Global Hunger Vulnerability Dashboard
This research dashboard maps hunger-related risk across countries using integrated data from the FAO, World Bank, climate vulnerability indices, conflict and disaster records, and related food security sources. It is designed for students, researchers, and anyone exploring how economic, environmental, and crisis factors relate to undernourishment worldwide.
What you can explore
- Global hunger vulnerability map — color-coded country scores from 0 to 100
- Country hunger profiles — detailed indicators, trends, and score breakdowns
- Statistical analysis — adaptation-buffer OLS models, global rankings, and Monte Carlo uncertainty across 143 countries
- Bangladesh research — climate change, floods, and food security (North Carolina Youth Institute / World Food Prize)
- About the project — research team, mentorship at Duke University, and acknowledgments
- Data sources and coverage — methodology transparency and source citations
Open the interactive dashboard
How the vulnerability score works
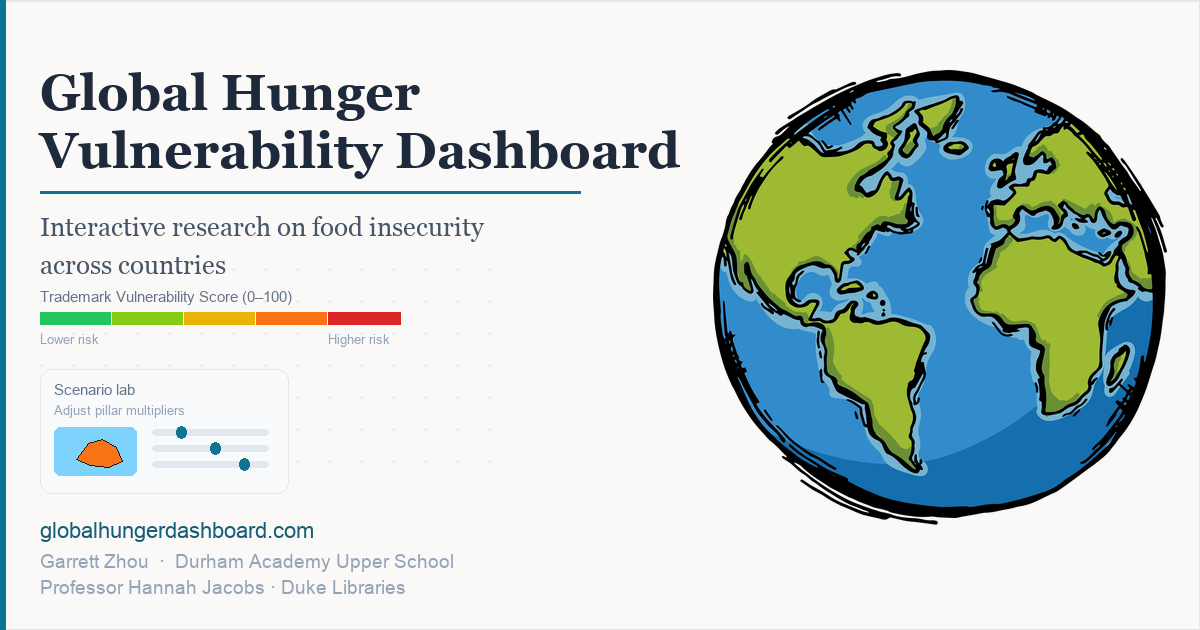
Each country receives a hunger vulnerability score from 0 to 100, built from twelve pillars that reflect different drivers of food insecurity. The pillars include undernourishment, poverty, income level, life expectancy, child stunting, climate vulnerability, conflict intensity, major hunger crises, food import dependency, daily food supply, water stress, and forced displacement. Each pillar contributes a capped number of points; the total is summed and capped at 100.
Higher scores indicate greater composite vulnerability. The map lets you adjust pillar multipliers to explore how much each factor shapes the ranking, while country profile pages always use the published default weights for consistent comparison.
Key sections
- Global hunger vulnerability map
- Country hunger profiles
- Global overview and charts
- Statistical analysis — adaptation buffer research
- Bangladesh climate & food security research
- About the research team
- Data sources and citations
About this project
The Global Hunger Research Project combines data science, geospatial visualization, and policy-relevant indicators to help users understand where hunger risk is concentrated and which structural factors may be driving it. The dashboard is led by Garrett Zhou with mentorship from Professor Hannah Jacobs at Duke Libraries. Data are drawn from publicly available international datasets and updated through a documented pipeline inside the dashboard.
Read more about the team and collaborators · View the Bangladesh research page